How the Fed Really Shrunk Its Balance Sheet
The Scale of the Shift
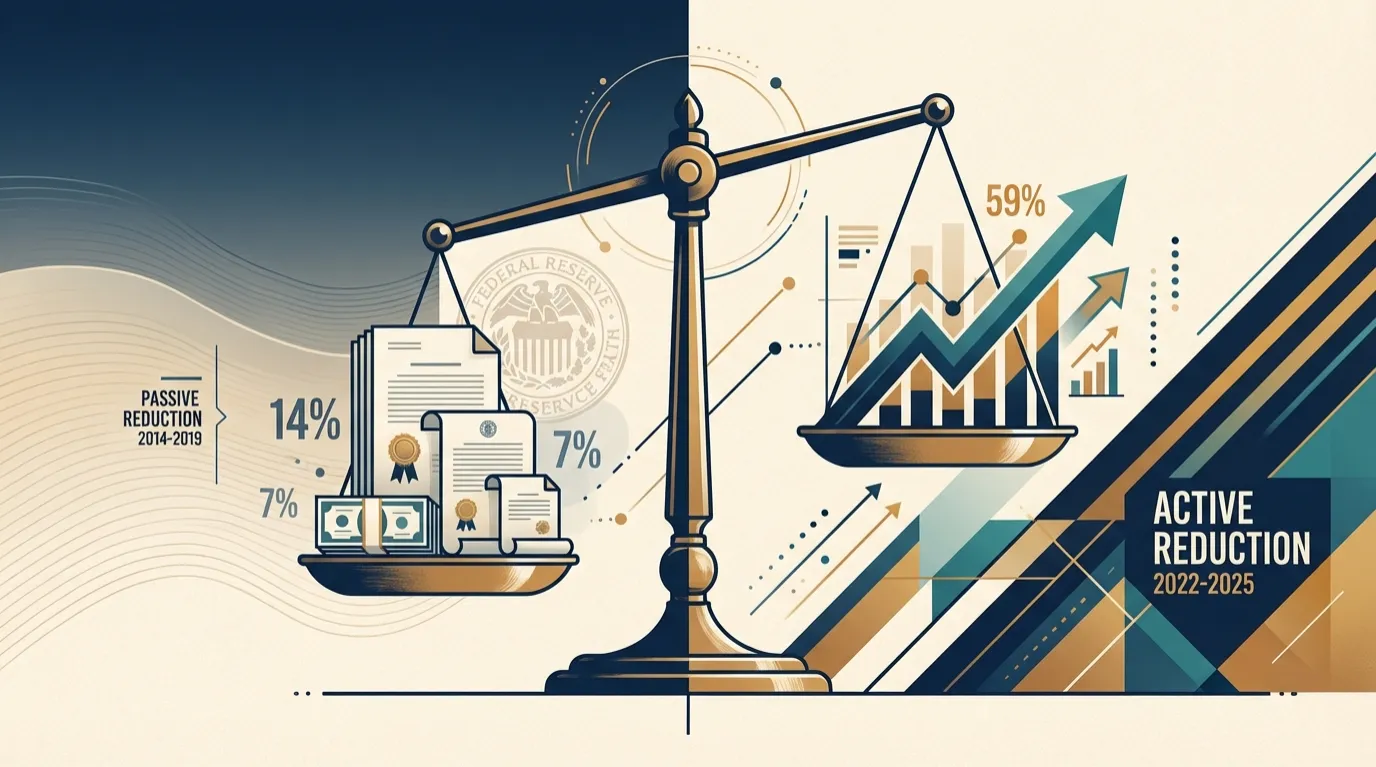
2022-2025
2014-2019
Previous Episode
The numbers tell a dramatic story. The recent balance sheet reduction was twice as large as the previous episode and happened in less than half the time. But what drove this accelerated pace?
Breaking Down the Numbers
Passive factors (economic growth + inflation) drove most of the reduction
Active reductions dominated as the Fed deliberately shrank its holdings
Two Ways to Shrink a Balance Sheet
Think of the Fed’s balance sheet like a pool of water. There are two ways to make it smaller relative to the size of the economy: you can actively drain water out, or you can wait for the pool to stay the same size while the economy around it grows bigger.
Fed researchers Benjamin Eyal, Dave Na, and Arsenios Skaperdas broke down the balance sheet reduction into three components:
The Three Drivers
- Active Reduction – The Fed deliberately selling or letting securities mature without replacement
- Economic Growth – As GDP expands, the same-sized balance sheet becomes smaller as a percentage of the economy
- Inflation – Rising prices increase nominal GDP, making the balance sheet smaller in relative terms
The composition of balance sheet reduction shifted dramatically between episodes
Why the Dramatic Shift?
The change in strategy wasn’t random. It reflected completely different economic circumstances and policy objectives.
2014-2019: Recovery Mode
The Fed was dealing with inflation below its 2 percent target. The economy was still recovering from the financial crisis. Policymakers emphasized a gradual, predictable approach. Their 2014 Policy Normalization Principles stressed taking it slow.
2022-2025: Overheating Economy
The economy was running hot. Inflation had shot well above target. The labor market was extremely tight. In FOMC meeting minutes, policymakers explicitly noted that a faster pace would play an important role in tightening monetary policy.
What the Data Reveals
Between 2014 and 2019, passive factors accounted for 56 percent of the total reduction. The Fed kept securities holdings constant for years before even starting to actively reduce them in 2017.
In contrast, from 2022 to 2025, active reductions comprised about 59 percent of the total decline. The Fed wasn’t sitting back and letting the economy grow around its balance sheet—it was actively pulling securities off its books.
Inflation played a bigger role this time too, contributing about 26 percent of the reduction. That makes sense given the post-pandemic surge in prices. Real GDP growth, meanwhile, accounted for just 15 percent.
The Bottom Line
This analysis reveals how central banks adapt their toolkit to different economic environments. The balance sheet isn’t just a passive residual from past policies—it’s an active policy instrument that can be adjusted based on circumstances.
When inflation is low and the economy needs support, policymakers can take their time unwinding emergency measures. When inflation is high and the economy is overheating, they can move much more aggressively.
By breaking down the numbers, this research helps us understand not just what happened, but why it happened. And it shows how the Fed has learned to use its balance sheet as a flexible policy tool, adjusting the pace and magnitude based on economic conditions.
As of late 2025, with balance sheet reduction now ending, the data confirms that the Fed delivered exactly what it promised: a significant and rapid reduction that helped tighten financial conditions when the economy needed it most.
Source
Eyal, Benjamin, Dave Na, and Arsenios Skaperdas. A Decomposition of Balance Sheet Reduction. FEDS Notes. Board of Governors of the Federal Reserve System, February 2, 2026.
