The Federal Reserve’s latest inflation numbers tell two very different stories—and understanding the gap between them matters more than you might think.
At the January FOMC meeting, Vice Chair Michelle Bowman voted to hold interest rates steady despite planning three rate cuts for 2026. Her reasoning reveals something most headlines miss: the inflation problem might be largely solved, even though official numbers suggest otherwise.
The 3% Number Everyone’s Talking About
Based on the latest reports, 12-month core PCE inflation likely stood at or slightly below 3% in December. That’s up from September, which sounds concerning. After all, the Fed’s target is 2%, and we’ve been stuck above that level for quite some time.
But here’s where it gets interesting.
What the Numbers Hide
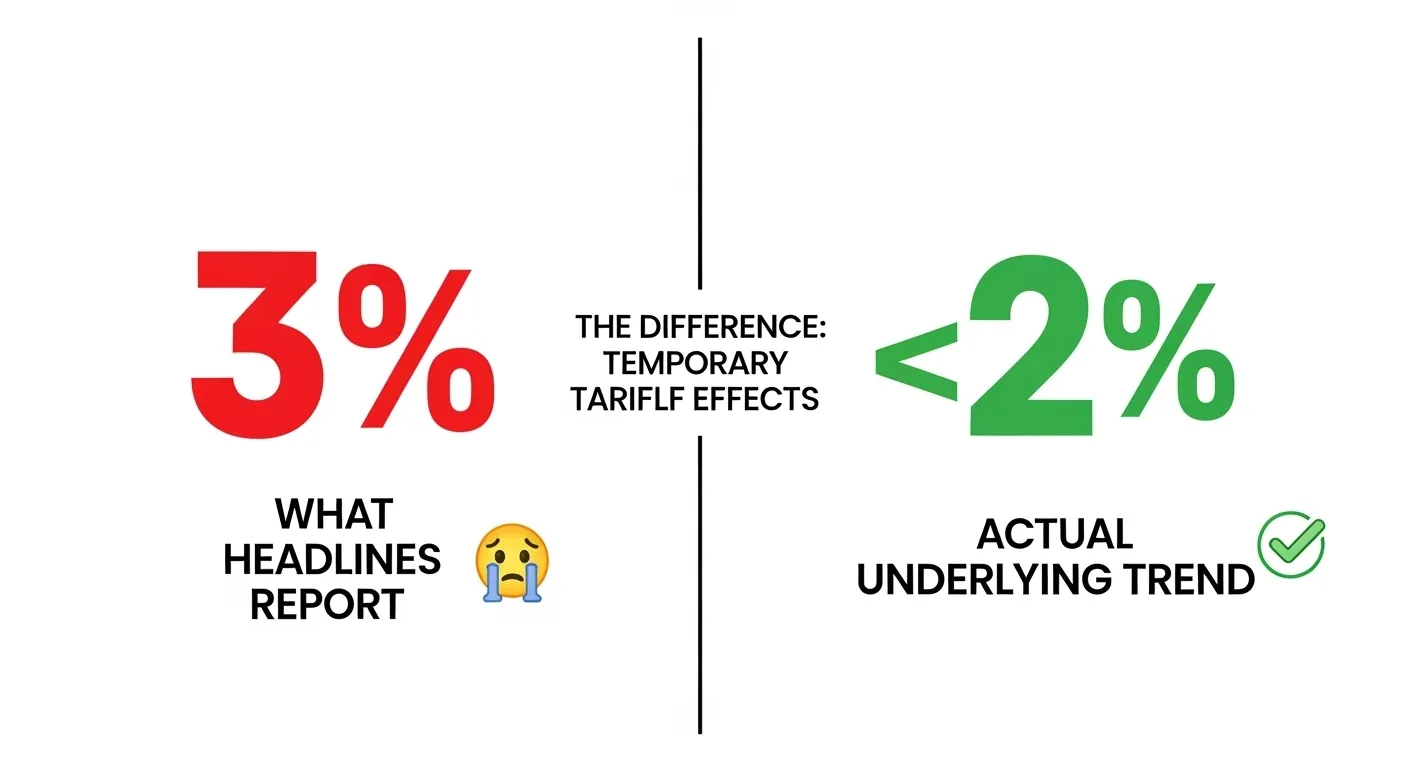
According to Bowman’s analysis, if you remove tariff effects on goods prices, core PCE inflation would have been hovering close to 2% in recent months. Not 3%. Not even 2.5%. Right around the Fed’s target.
This isn’t creative accounting or wishful thinking. Tariffs create one-time price level shifts that show up in year-over-year inflation calculations but don’t represent ongoing inflationary pressure. They’re temporary distortions, not a sustained trend.
Bowman expects these tariff effects to fade throughout 2026. As they do, the headline inflation number should catch up with what’s actually happening beneath the surface.
The Real Story in Alternative Measures
The Fed doesn’t just look at one inflation measure. They track several, and some tell a clearer story than others.
The Dallas and Cleveland Fed produce “trimmed-mean” measures of both PCE and CPI inflation. These strip out the most extreme price changes in either direction to focus on the underlying trend. Right now, these trimmed-mean measures show that 12-month core inflation has continued to decline—directly contradicting the uptick in the standard core PCE measure.
Why the discrepancy?
Small Categories, Big Impact
Recent data has shown unusually large price increases in surprisingly small categories. Software and video streaming services are prime examples. These aren’t economy-wide trends. They’re specific price movements in narrow segments that happen to carry enough weight to skew the overall number.
When a few small categories experience volatile price swings, they can distort the headline figure without representing what’s happening to prices across the broader economy. That’s exactly what we’re seeing now.
The underlying trend in core PCE inflation, according to Bowman, “appears to be moving much closer to our 2% target than is currently showing in the data.”
Why This Matters for Policy
This distinction isn’t academic. It directly shapes Fed decision-making.
If inflation were genuinely stuck at 3% with no clear path down, the Fed would need to keep rates higher for longer. But if the real underlying trend is close to 2%, with temporary factors masking that progress, then the case for rate cuts becomes much stronger.
Bowman’s view is that “with inflation close to 2%, after excluding one-off tariff effects,” the Fed’s current policy stance remains moderately restrictive. In other words, rates are still tight enough to slow the economy, even though inflation is essentially solved.
This perspective explains why she includes three rate cuts in her 2026 projections despite the 3% headline number.
The Bigger Picture
The gap between headline inflation and underlying trends highlights something important about economic data: context matters more than the number itself.
A 3% inflation reading doesn’t mean the same thing in every situation. When it reflects temporary tariff effects and volatility in small categories rather than broad-based price pressures, it tells you less about where inflation is heading than where it’s been.
As Bowman noted, “the underlying trend in core PCE inflation appears to be moving much closer to our 2% target than is currently showing in the data.” That’s the signal the Fed is paying attention to—not just the headline.
What to Watch
As we move through 2026, watch for those tariff effects to fade from the year-over-year calculations. When they do, expect the headline inflation number to drift closer to 2%.
Also keep an eye on those trimmed-mean measures from Dallas and Cleveland. They’ve been more accurate indicators of the underlying trend, and they’re already showing continued progress toward the Fed’s goal.
The takeaway? Core inflation might already be close to where the Fed wants it. The headline number just hasn’t caught up yet.
And that difference could determine how quickly interest rates come down this year.
